Environmental Analysis Map Viewer
Loading...
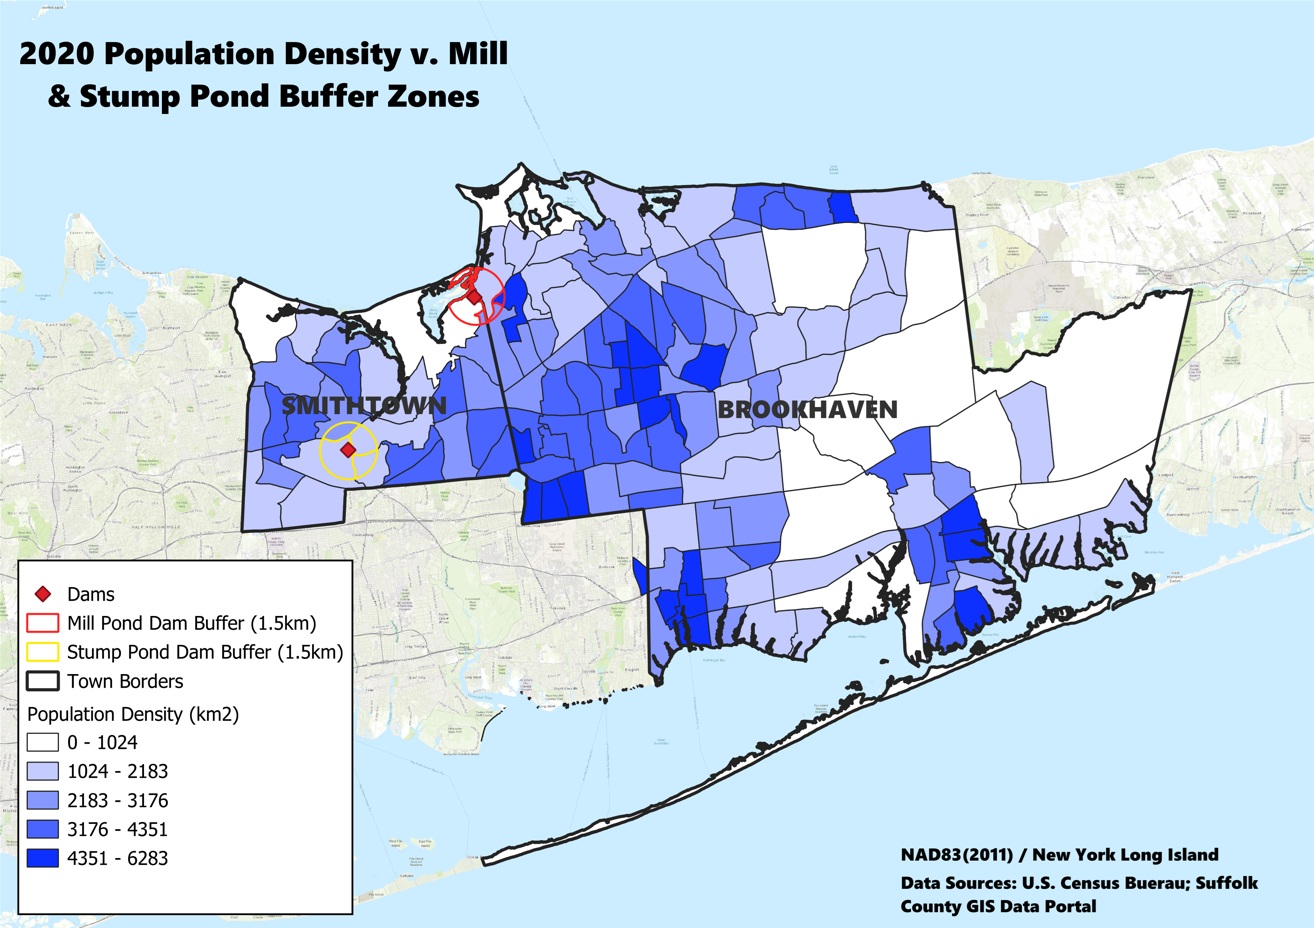
Environmental Analysis Map
Suffolk County, NY
Explore various environmental and demographic datasets. Use the layer control (top right) to toggle layers and switch basemaps.
Layers
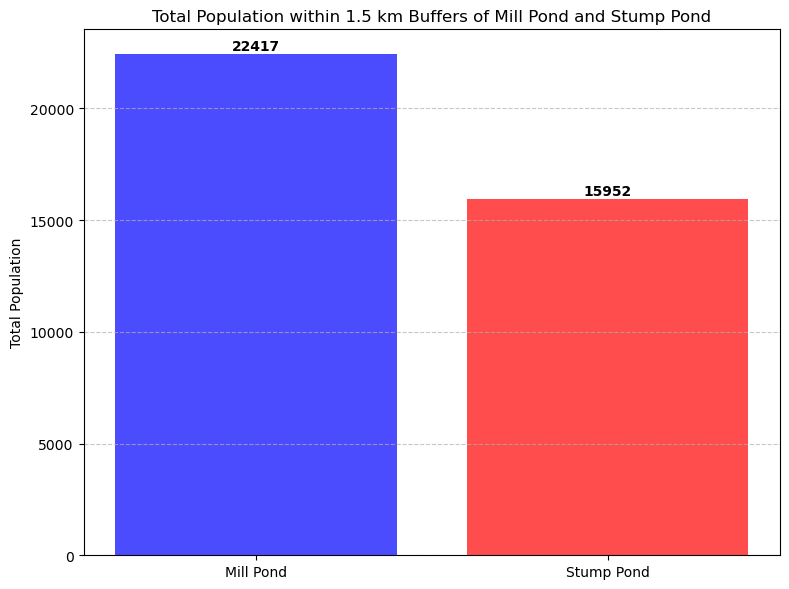
This interactive map allows for the exploration of various environmental and demographic datasets related to the Suffolk County Ponds. You can toggle different data layers, including population density, town boundaries, watershed areas, FEMA elevation data, coastal risk zones, and land use. Use the layer control icon (usually in the top right of the map) to select layers and change basemaps. Click on features for more information (where available). The legend (bottom right) provides details about the currently displayed data.